Traffic monitor
The Traffic monitor shows requests, errors and latency in real time, per host and per path.
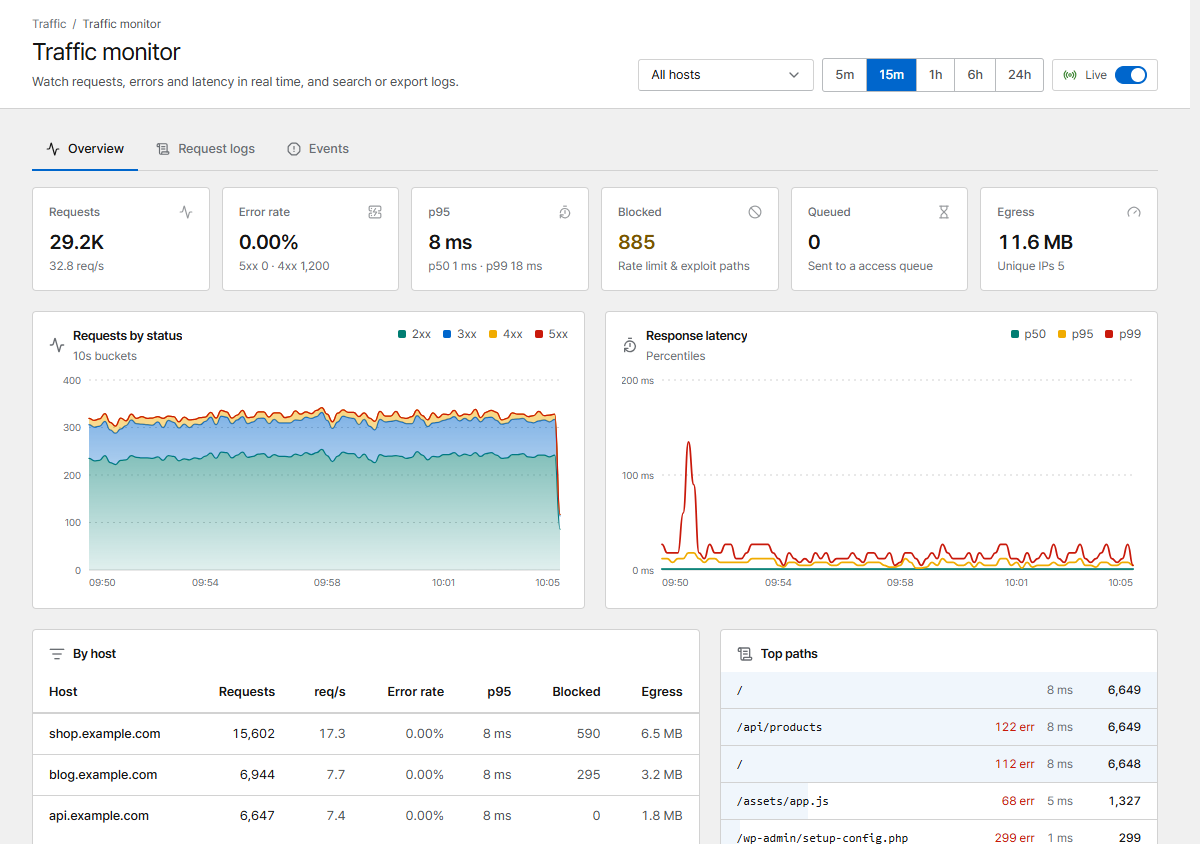
Choose a host (or All hosts) and a time range at the top. Live updates the page every few seconds.
Overview
- Requests, Error rate, p95 latency, Blocked (rate limits and exploit paths), Queued (sent to an access queue) and Egress
- Requests by status and Response latency (p50 / p95 / p99) over time
- By host and Top paths: where the traffic and the errors are
Request logs
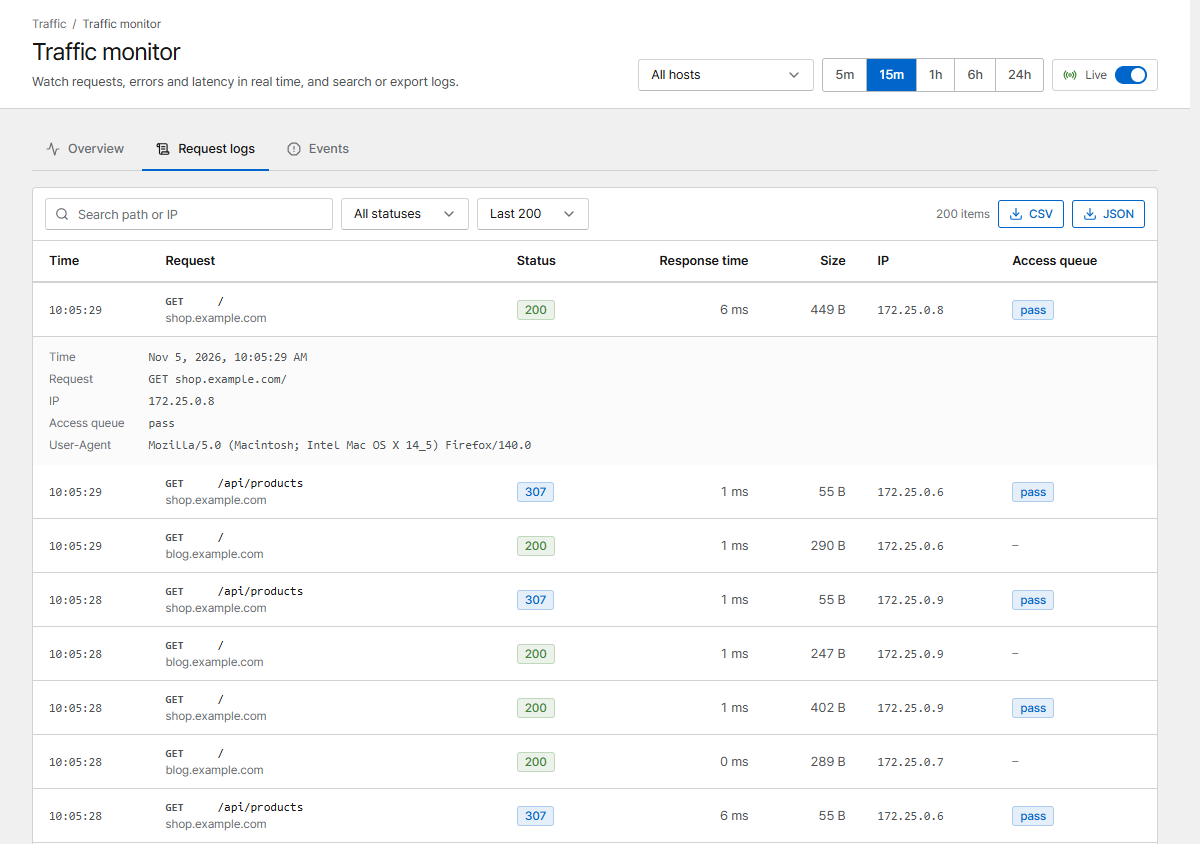
Search requests by path or IP, filter by status, and export them as CSV or JSON. Click a row to see the details: time, full request, IP, User-Agent, the security rule that matched and the access-queue decision.
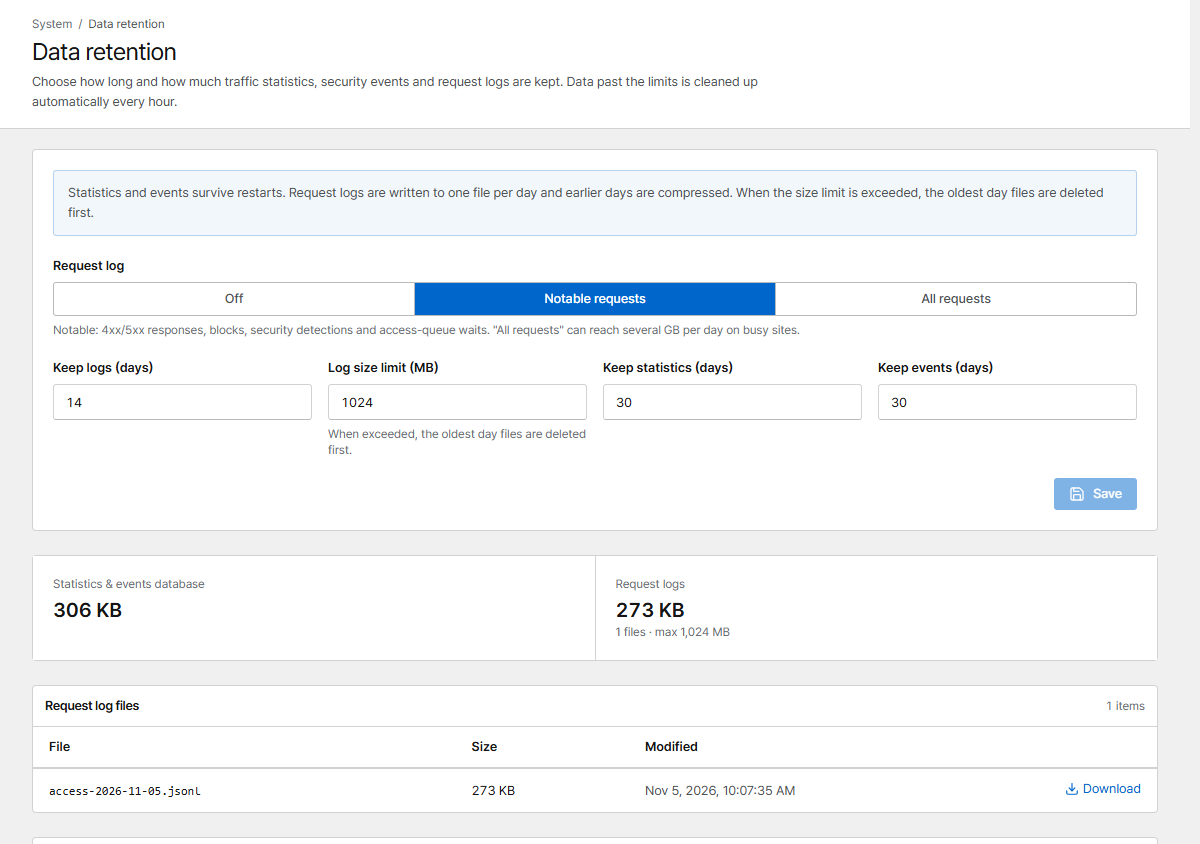
Which requests are logged is set under Data retention → Request log:
| Mode | Logged |
|---|---|
| Notable requests | 4xx/5xx responses, blocks, security detections, access-queue waits |
| All requests | Everything (can be several GB per day on busy sites) |
| Off | Nothing |
Logs are written to one file per day and older days are compressed. When the size limit is reached the oldest days are deleted first. Statistics and events are kept separately (see Data retention).
Privacy
Network → Mask IPs in logs hides the last part of client IPs in logs and exports.
Events
Blocks, rate limits, challenges, server errors and access-queue waits in time order. Security rule matches are also listed under Security rules → Rule events.
Prometheus
/metrics on the admin port exports Prometheus metrics. Create an API token
with the Viewer role and scrape with Authorization: Bearer <token>.